Put it to Practice - Presentation of Data
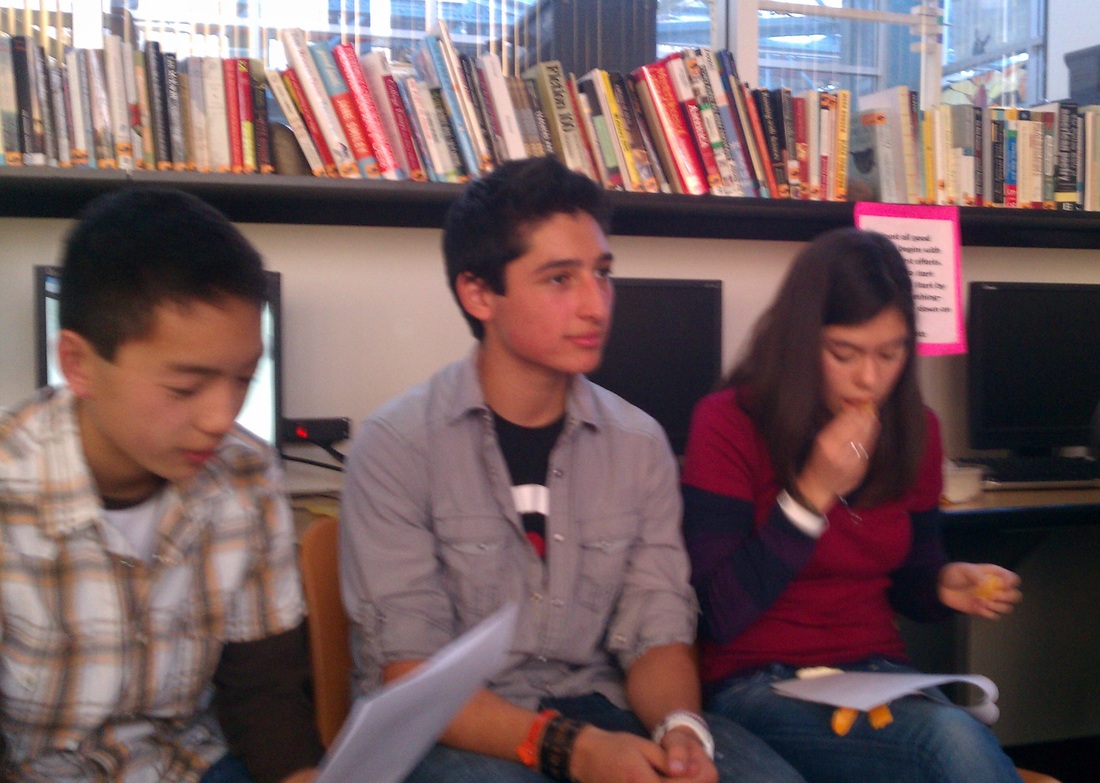
The above video captures a focus group pertaining to the "Challenge Day" activity being planned at HTHNC. The current issue facing the activity is how to meet the student leaders' needs of being supported via effective planning, and the teachers' needs of having adequate time to prepare for a disruption in their regular class schedule. The video captures only the presentation of data portion of this meeting. The data was collected using a survey of approximately 50 questions asking student leaders to rank their skills in group facilitation, assertive communication, and related topics.
PITP Reflection
The Big Picture
Prior to starting this class, I admit that my views of data were somewhat cynical and simultaneously superficial. Richard Farson would probably argue that this is an example of Chapter 1 of Management of the Absurd in terms of the “coexistence of opposites” (Farson, 22). I would say cynical because, as a historian, I know that data often comes down to the person using it; it can be used to support, deny, refute or indicate many things depending on who is wielding it. I would also superficial because at the outset, I simply thought of data as statistics. Statistics are completely acceptable, and a legitimate form of data, but they are also only one of a seemingly endless array of data available.
It is in the context of more superficial data that I think that schools generally focus on. In particular, this often comes down to test scores. While the general trend in education, especially progressive education, is to disavow test scores as a quick Google search will demonstrate, it is important to recognize that test scores do in fact measure many standards and accomplishments. For example, a standardized test can indicate general trends across a period of time. Take the example of the California History Standards. In the 10th grade, many California high schools attempt to get through the end and results of World War II – CA History Standard 10.8. This means that by the end of the academic year, standards 10.1 through 10.8 are generally completed. Interestingly, the CA STAR test contains questions dealing with historical events and figures that come much later in a chronological timeline, and the STAR is usually given in March or April. Therefore, not only do many schools not cover some of the material that is on the test, some schools won’t cover approximately 1/3 of what appears on the test! As a school leader, if I was looking at grade-wide STAR test data and saw that many students were answering 1/3 of the history questions incorrectly, I might be alarmed. But, what I’m really looking at is a measure that shows me a general trend of how far along the history classes are in March or April. Test scores measure what a student remembers from a specific class on a specific day under specific condition. It is important to understand that while test scores do not define us as teachers or as schools, they do provide general indicators especially when viewed in a macro sense.
Beyond the test scores, schools should also be looking at things like college acceptance, and post-high school career selection. Schools can also look at data measuring affective standards as well. Things like attendance, student perception of rigor, safety, etc. can provide an important window to how successful a school is meeting the needs of students. Imagine if a school leader noticed a correlation between attendance and students who repeatedly take summer school classes. Or a correlation between FRL students, use of public transportation, and student perception of safety. These sorts of indicators can provide much more valuable (if not to politicians and community officials but to actual stakeholders in the school) information than a standardized test score summary.
To support colleagues in using data to inform practice, I think it’s important to remember that data is simply another word for evidence. If you think you are being successful with a certain class, what does the evidence show? It’s a similar question that we would ask students, and it’s important to ask colleagues the same thing. If you think you are ineffective in project design, what does the evidence show?
Picking the right evidence can be just as important as actually measuring it. For the example regarding project design, something like student satisfaction would be a good indicator. This could be measured in a survey, a focus group, or a classroom discussion. There are numerous ways to collect evidence and data, it’s really more a matter of availing yourself to them. Of course being willing to accept, and make changes based on, the results. In order to encourage school staff, I think that requiring mid-year or end-of-year surveys as a professional development activity is a good start. These wouldn’t have to be shared with anybody but I believe they would be useful to draw upon for year-end wrap ups. To use the example above, if a school leader is completing a year-end wrap up with a teacher and the teacher says “It was a very successful year for me” it would be great for that teacher to be able to show the student survey that supports that assertion.
Actual PITP
For my PITP using data, I wanted to measure student perception of efficacy as it pertains to our upcoming HTHNC Challenge Day activity. In the Challenge Day activity, student leaders engage their colleagues in structured, and difficult, conversations regarding topics such as bullying, sexuality, academic struggles, etc. We conducted this activity last year, but students had relatively little training leading to some groups going exceptionally well while other groups struggled. The goal this year was to provide more training to students in order to prepare them to lead groups rather than simply be the ones who spoke most, or just asked the questions.
The challenge here was, and continues to be, other students’ negativity towards the event. This is taking a tremendous toll on the student leaders’ confidence and perception of their own ability to conduct their groups with gusto. I wanted to capture their own perceptions of these abilities prior to completing the training sessions (approximately 40 hours) and then have them complete the survey again at the end of the training sessions. My suspicion is that a marked increase in perceived effectiveness and ability will be demonstrated. This standard pre/post survey model has yielded useable results in the past work I have done in youth development, and it seemed most fitting for this group and event.
The survey was focused on how the students identified their own abilities and their own feelings towards the topics we were preparing to engage other students in. The responses to the questions were mostly on a 5 point scale, with the lower numerical value indicating a low efficacy with the high number indicating a higher sense of efficacy. In its original incarnation, the survey was entirely about the student and their own perceptions. However, after going through a project tuning with a thoughtful and helpful critical friend, I added more open-ended questions per the requests of said critical friend. I also revised a few of the questions to be more clear in terms of what was being asked. One of the interesting things to come out of this process was my critical friend’s suggestion that there should be a question regarding what students wanted teachers to do during the Challenge Day activity. These responses were directly used to facilitate the meeting with colleagues.
The meeting with colleagues went reasonably well. Rather than just presenting the data and leaving it to be, I used a modified dilemma protocol as I was running into very real logistical problems in terms of scheduling the actual event. I did not want to make such a community-effecting decision without the input of teachers who would be directly affected by that decision, so I presented the dilemma as “how can I meet the needs of student leaders and the needs of teachers for Challenge Day?” I began by presenting the data (as seen on the video), and then asking for clarifying and probing questions. My colleagues then began their discussion, presenting alternative schedules, ways to include more students, how to select groups, etc.
If I were to conduct this meeting again, I would present a more cogent summary of the data. As seen in the video, there is a lot of data to present and not all of it pertains directly to the question posed above. For example, I present lots of information regarding what students felt comfortable leading discussion about although my question really didn’t address that issue. One of my colleagues also made note of the fact that this survey was conducted prior to the trainings being completed therefore what students identified as difficult to talk about may actually change as they attended more trainings. Touché.
Had I the ability to go back and collect more data, I would want to get more student feedback about the day itself. One of my colleagues asked a question regarding student preference about the event, and the only data I had was one question dealing with group selection. In hindsight, I would want to know a bit more about their reasoning for their responses.
As I prepare to continue to use data, I continue to wonder what types of data are the most useful for certain inquiries. And how can I gather data using something other than surveys? I think that this is perhaps most useful at a school that uses surveys frequently and “survey burnout” sets in after the third or fourth survey, even though the third and fourth survey are not any less important than the first or second survey.
| data_pitp.pdf |
Immersion Project (High Tech High, Point Loma)
Brett Peterson, Historian
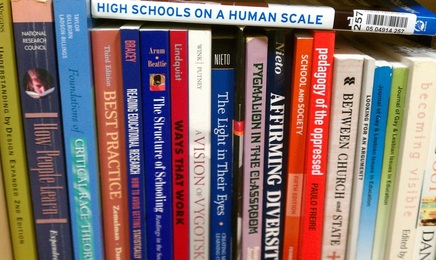
Brett Peterson is a historian. One look around his office will tell any visitor that. He has books by Zinn, Barzun, Krakauer, and other academic and popular historians. I asked him if he was a humanities teacher and he commented that "No, I'm a historian." As a fellow historian-turned-educator, I believe that the distinction is important. A humanities teacher instructs, educates, and opens new worlds for students. A historian uses historical experiences to inform decisions, be them professional or personal. I asked Brett if the students recognize him as an expert in the field, given that he has been Director of HTH long enough that all students know him only in that role; Brett accepted the role of Director for the 2007-2008 school year, meaning that the last group of students who knew him also as a teacher graduated last year. He replied that many students do recognize him as somebody who can help with editing and revising papers, evaluating project work, and analyzing different historical readings. One of the ways he keeps this going is to not only keep shelf upon shelf of historical reading and texts in his office, but by keeping an additional bookshelf of books directly outside of his office.
Brett Peterson, Educator

This is a small section of Brett's books. There is another shelf on top, and another to the right!
In addition the massive shelves of historical texts, anthologies, and readers, Brett also has several shelves dedicated to the art and practice of education and teaching. I always find it to be incredibly interesting to see what books people keep at home, at work, in their car, with them while they walk, etc. I think that the books that people read and keep are incredibly indicitave of many things; in the case of teachers I think it's almost just as telling as a short classroom observation. Having books available for reading in an office or a classroom tells anybody who walks in that reading is valued, literacy is continually practiced, and that books are prized.
The books regarding education that Brett keeps available all demonstrate his commitment to progressive education. A student sitting within reading distance would see that Brett is not only concerned with how to teach, but how to support all students.
The books regarding education that Brett keeps available all demonstrate his commitment to progressive education. A student sitting within reading distance would see that Brett is not only concerned with how to teach, but how to support all students.
Schedule? What Schedule?
This student called his mom regarding the Posada. She confirmed her attendance. Success!
Upon my arrival, I asked Brett a little bit about what we would be doing and what the schedule looked like. He commented that while there wasn't a lot that he had scheduled for the day, there was a lot to be done. From being in school leadership for a short time, I know that the job of school leaders is often a constant series of interruptions and the trick is figuring out which of these interruptions demand your attention and which can do with somebody else's attention. Of the interruptions that require your attention, a second layer is then prioritizing them into what is urgent and what is important. Because of this constantly arrested process, having a schedule doesn't always seem to make a lot of sense. Rather, having a set of tasks that you would like to accomplish and a list of tasks that need to be accomplished can be a helpful framework for the day of a school leader. In this case, an urgent matter facing Brett on this day was the Posada event happening that evening. The event is an outreach event meant to connect, and strengthen the bonds, between the school and the Latino parents of HTH students, and Brett was concerned about attendance. He explained to me that in the past, parents have expressed the need to be personally invited to a school event. An email won't get read, a voice mail may do the trick, but a personal invitation either from the student or from school leadership will likely lead to the desired result. So, we hit the halls! Every student we came across who had Latino parents, Brett stopped and talked to them about the Posada. As we talked with students, they usually asked "Oh, can I call my mom and tell her?" They would, and sure enough, the vast majority of calls were successful. This simple, personalized approach helped not only get the parents to the event, but showed them that they were not a marginal group in the school community, but a group that was important and valued.
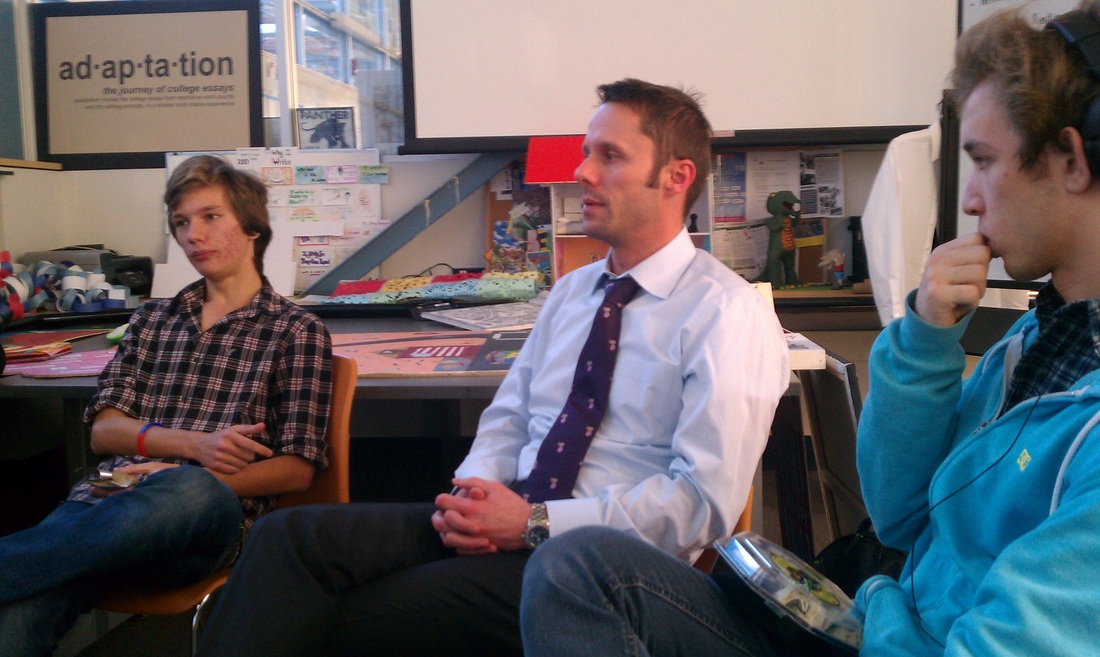
The World's Shortest Interview
By being out and about within the school, students have tremendous access to Brett.
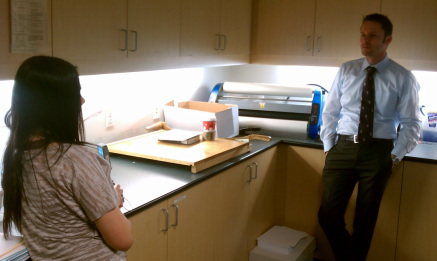
It can get easy, perhaps even tempting, in school leadership (just as in teaching) to retreat to one's office and attempt to buckle down and get some work done. In my shadowing with Brett, there was no retreat to the office. Ever. Although never explicitly described, it seems that Brett strives to be available for whomever may be looking for him - students, teachers, Marcus, GSE students, GSE faculty, etc. By being out in the school, rather than in his office, Brett establishes a presence within the community that allows access (especially to students) and availability to staff. One student jumped on the opportunity and asked Brett if he would have time to be interviewed regarding bullying in high schools. He replied that he would definitely have time, and they could conduct the interview right now! Such luck! We all ducked into the copy room, and the student readied the camera. She checked the lighting. Check. She checked the lighting. Check. She checked her interview subject. Check. Then she asked one question. And then the interview was over! Perhaps Brett's response was so articulate that no further elaboration was needed? Nailed it.
Hallway Conversations

This is Ace. He is not an official HTH teacher.
In between the interviews and finding students to invite their parents to the Posada, there are the needs of teachers to be met as well! While were doing the activities described above, teachers would approach Brett and talk informally in the hallway. One teacher walked and talked with us regarding Intersession. Another teacher stopped and talked with us regarding a student who was struggling in their class. A third teacher talked with Brett regarding curriculum. These informal talks were often productive and helpful. Also, these discussions were generally an extension of Brett's constant availability. The words "I can't, I'm too busy" didn't seem to be in Brett's lexicon, and all who needed something were given some sort of input.
Salacious Student Senate Skit of Scandal!
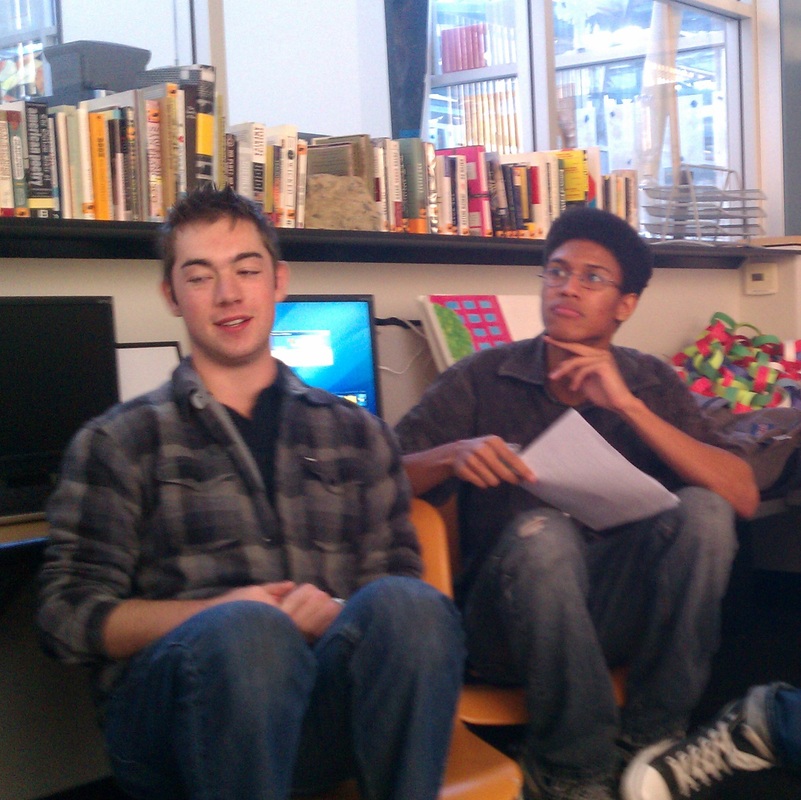
One of the many duties that Brett fills as Director is to chair the Student Senate of HTH. The student Senate is not the same as ASB, although 3 of the 7 Senators are also involved with ASB. The two bodies serve different a relatively similar purpose - student voice - although through somewhate different means. While the ASB, according to theHTH Senators, is charged primarily with planning various campus events, the Senate seeks to ensure that student voice is included and considered in decision making. They do this by attending staff meetings, getting students involved in leadership opportunities, and attempting to capture student opinion and feedback.
The goal for this meeting was to finalize details for a skit that the Senators would be performing the following day at a Community Meeting. The purpose of the skit was to get additional students to join the ranks fo the Senate. The thought was that they would show what a staff meeting looked like without the Senate representative, and then to show what that same staff meeting would look like with the Senate Representative present. Of course, the only way to do this in an engaging way was for the Senators to pretend to be their favorite teachers. One student really struggled with nailing an English accent for Dr. Gloag, but they eventually hit their stride. Brett was there to help facilitate and give them some focus and structure. He also reminded them that the script and their imitations could not be offensive or derisive. This only proved to be an issue once, and when it was brought to the attention of the student, he was seemingly embarrassed that he wasn't within the perameters of "in good fun."
The goal for this meeting was to finalize details for a skit that the Senators would be performing the following day at a Community Meeting. The purpose of the skit was to get additional students to join the ranks fo the Senate. The thought was that they would show what a staff meeting looked like without the Senate representative, and then to show what that same staff meeting would look like with the Senate Representative present. Of course, the only way to do this in an engaging way was for the Senators to pretend to be their favorite teachers. One student really struggled with nailing an English accent for Dr. Gloag, but they eventually hit their stride. Brett was there to help facilitate and give them some focus and structure. He also reminded them that the script and their imitations could not be offensive or derisive. This only proved to be an issue once, and when it was brought to the attention of the student, he was seemingly embarrassed that he wasn't within the perameters of "in good fun."
The Take Away
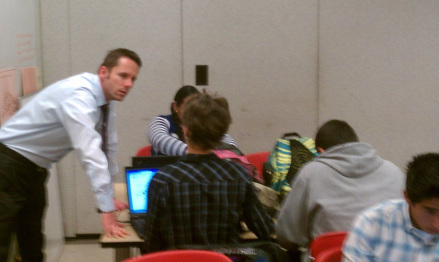
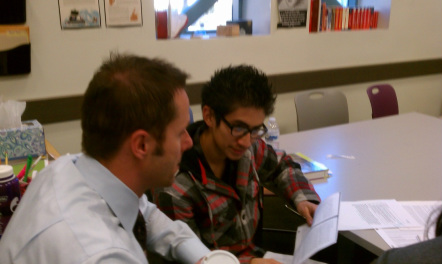
A student explains his physics project to Brett during a classroom observation.
Insights and Practice
After my shadowing experience with Brett, I started to think about what it was that I saw that I would be able to put into my own practice. The thing that continually struck me during my time with Brett was the focus on availability. Like I stated above, the words "I'm too busy" don't seem to be in Brett's vocabulary. Brett consistently makes himself available to students and staff alike, and seems to have a good understanding of what is urgent, and what is important. Brett was rarely attached to his computer, and was able to be in classrooms and community spaces fully present. This is something that I would like to continue to work on in my own leadership position. I find it difficult, especially when I am in my office, to be working on things without the interruption of email. In a practical application, Brett has a separate workspace set up away from his computer that aides him in cutting the e-cord. This sense of being available was something that came up multiple times throughout the experience, and altered my view of what school leadership really means.
The other thing that I noticed while shadowing Brett was the immense difference of the Dean/Director relationship. I asked Brett about this and he commented that the nature of the Dean/Director relationship changes wildly across schools. While he and Marcus (Dean of Students) work incredibly independently, other Deans and Directors work collaboratively, and other Deans and Directors work almost interchangeably on many issues. But what does that mean for my own practice? I suppose that it reaffirms my idea that there is no "right" way to conduct a Dean/Director relationship; the relationship is almost entirely dependent on the personalities involved.
The immersion experience was great to see the technical aspects of school leadership that sometimes I am stimied about. It wasn't revelatory in terms of seeing the role of school leadership as something different than what I already knew, but that's okay. Seeing the different techniques used by various school leaders was more important than sitting down and just hearing about what a school leader does.
Hopes
Throughout the immersion experience, I saw things that I figuratively tucked into my pocket for my own use later. The first was the oft mentioned available nature of the school leaders I was able to observe. Even observing Susan Battistutz at HTMNC I saw this same push for access that I saw with Brett at HTH. I hope that as I develop my own leadership style, that I retain and capture that same available nature.
The second item that I tucked away for future use was the willingness to wear many hats, and to adapt quickly and frequently. School leadership is something that is seemingly always changing; one day is often very different from the next. It is important that the school leader not be so married to either their own way, or their own preconceptions about something that they are not willing to step in when needed, or to act responsively rather than reacting to the situations that arise.